
Featured article
Solutions


Products


Resources


User guide
Device View Measurements
The Measurements page allows you to view four charts of detailed measurements for the device.
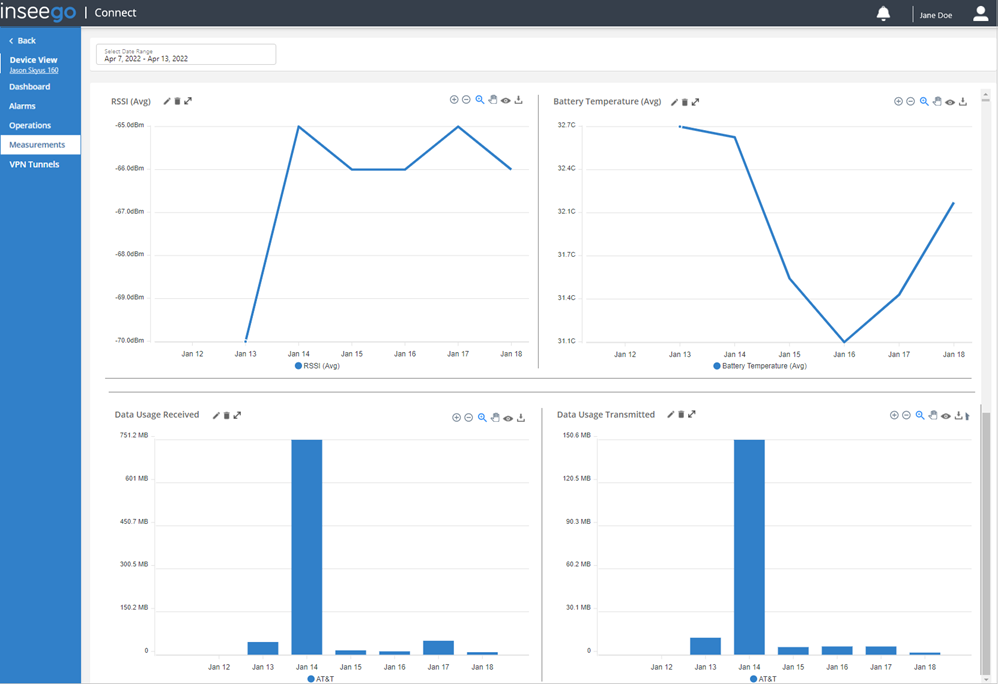
To display charts, follow these steps:
1. Click the Select Date Range box (upper left). You can choose a date range from the list on the left, select the beginning and end of a range of dates from the calendar, or choose a single day by clicking on the same day twice. NOTE: Inseego Connect stores 90 days of data.
2. Click the + Add Chart button.
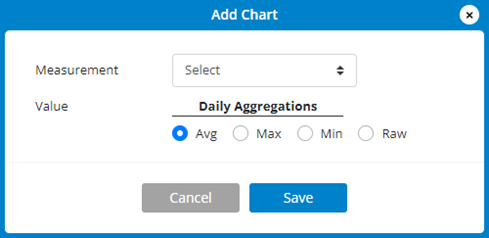
- Select a Measurement from the dropdown (RSSI, RSRP, RSRQ, SINR, SNR, Data Usage Transmitted, Data Usage Received, Data Usage Total, Battery Voltage, Battery Temperature, or Battery Level).
- Select a Value (Avg, Min, Max, or Raw) to display the measurement in the chart.
- Click Save.
3. Repeat step 2 to create other charts.
TIPS
 Use the pencil icon to edit the chart.
 Use the trash icon to delete the chart.
 Use the expand icon to expand the chart.
 Use the plus and minus icons to zoom in and out.
 Use the zoom icon and select a portion of the graph to focus on.
 Use the hand icon to scroll through larger charts.
 Use the eye icon to reset zoom.
 Use the download icon to download an SVG, PNG, or CSV file of the chart.