User guide
Home
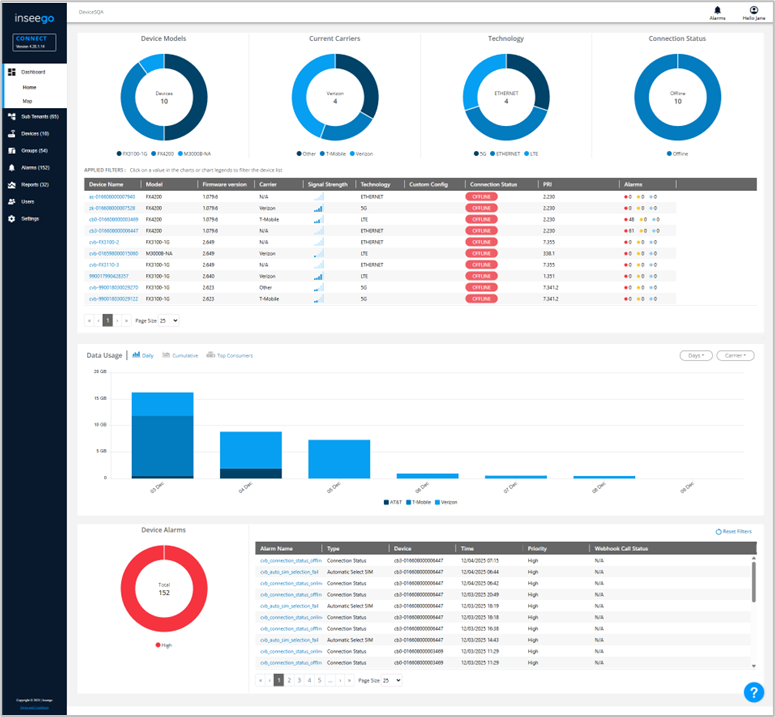
The Dashboard Home page displays charts for device models, current carriers, technology, and connection status. It also provides details on devices, a data usage graph, and alarm information.
This page appears upon login. You can navigate to it from other pages by selecting Dashboard from the side menu.
NOTE: You can click on a device name to access a device-specific dashboard that only displays information for that device (see Device View Dashboard for more information).
Charts
The charts at the top of the page provide visual displays of information about devices registered with Inseego Connect.
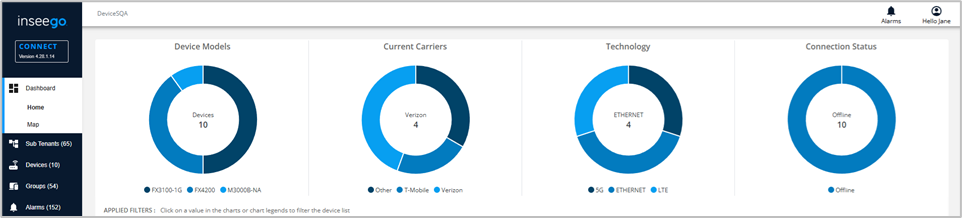
Device Models
Displays the count of each device model that is currently connected to Inseego Connect.
Current Carriers
Displays the count of devices that are connected to Inseego Connect through each specific carrier.
Technology
Displays the count of devices that are connected to Inseego Connect by technology (for example: Ethernet, LTE, or 5G).
Connection Status
Displays the count of devices that are online (currently connecting with Inseego Connect) and offline (not currently connecting with Inseego Connect).
TIPS
- Hover over a color in a graph for details.
- Click on a color to filter the Device table below for that element. If you click on additional colors in any graph, filtering includes those elements as well. Select Clear all filters to clear your selections and view data on all devices.
Devices
This table provides information on all devices registered with Inseego Connect.
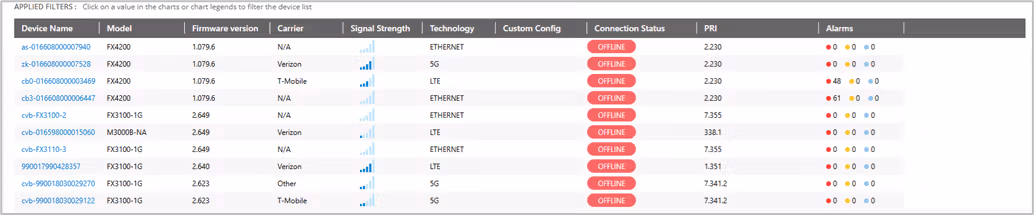
Device Name: The name or IMEI of the connected device.
NOTE: When you click on a device name, a dashboard with details for that device appears (see Device View Dashboard).
Model: The model of the device, for example, MiFi M2000.
Firmware version: The version of firmware on the device.
Carrier: The vendor that provides wireless access for the device.
Signal Strength: Displays network signal strength. More bars indicate more signal strength.
Technology: Indicates the current data connection, for example, LTE or 5G.
Custom Config: If the device belongs to a config group, any custom configurations applied to the device.
Connection Status: Whether the device is currently online or offline.
PRI: The configuration version currently applied to the device.
Alarms: The number and type of alarms currently unresolved for the device.
TIPS
- Click a column header to reverse the display order for that column.
- To filter the information in this table, click on colors in the graphs above. For example, to see a list of MiFi M3000 devices on 5G, select the color for MiFi M3000 in the Device Models graph and the color for 5G in the Technology graph. Select Clear all filters to clear filters and show all devices.
Data Usage
The Data Usage graph provides data usage (In MB or GB) for all connected devices.
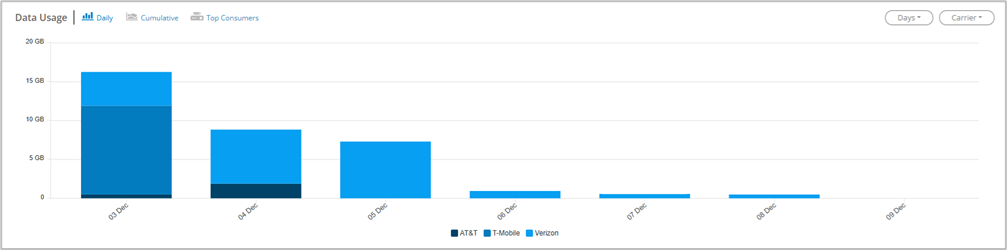
You can select from the following display options on the upper left:
Daily — Displays data usage for all connected devices per day. Use the dropdowns in the upper right to change the number of days displayed or to filter on a specific carrier.
Cumulative — Displays 30 days of cumulative and projected data usage for all connected devices. The projected data usage is forecast based on usage patterns from the last 30 days. Use the dropdowns in the upper right to select a billing start date to store for each carrier and to filter on a specific carrier.
Top Consumers — Displays data usage for the ten devices using the most data. Check the Show average checkbox in the upper right to display a dotted yellow line marking the average usage for this account. Use the Days dropdown to display usage for 7 or 30 days.
TIPS
- Hover over a color in a graph for details.
- Hover over Time zone in the bottom right to see the time zone for which daily data usage values are calculated. You can change the time zone on the Settings page.
Alarms
The Alarms section contains a chart and a list providing alarm information.
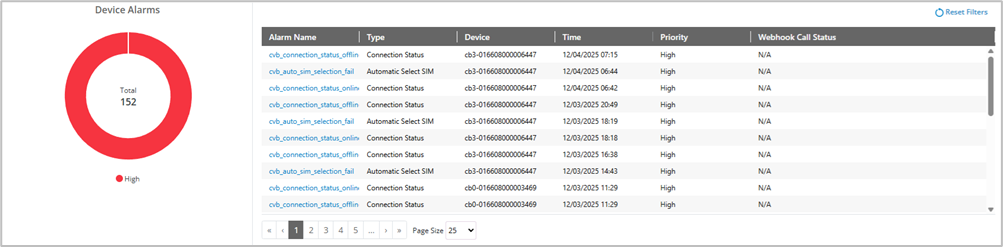
Device Alarms chart
Displays alarms in low, medium, and high priorities.
TIPS
- Hover over a color in a graph for details.
- Click on a color to filter the Alarms table for that priority. If you click on additional color, filtering also includes that priority. Select Reset Filters to clear your selections and show all alarms.
Alarms List
The list provides details for all currently unresolved alarms on all registered devices:
Alarm Name: The name of the alarm.
NOTE: When you click on an alarm name, a popup with details for that alarm appears. When you click Close, the popup closes, and the alarm remains listed in the list. Click Dismiss to dismiss the alarm. You should dismiss an alarm once the triggering event is understood and any necessary actions have been taken. Dismissing an alarm removes it from all alarm lists so users can focus on unresolved alarms.
Type: The type of alarm (Connection Status, Device Data Usage, Carrier Data Usage, SIM Data Usage, WAN Data Usage, Measurements, Geofence, VPN Tunnel Status, Cellular Failover, WAN Failover).
Device: The name of the device with the alarm.
Time: The date and time of the alarm.
Priority: The priority of the alarm.
Webhook Call Status: The status of the last webhook call (Success, Fail, Timeout, Skipped).
TIP
- Click on a color in the Device Alarms chart to filter the list for that priority. If you click on additional color, filtering also includes that priority. Select Reset Filters in the upper right to clear your selections and show all alarms.


